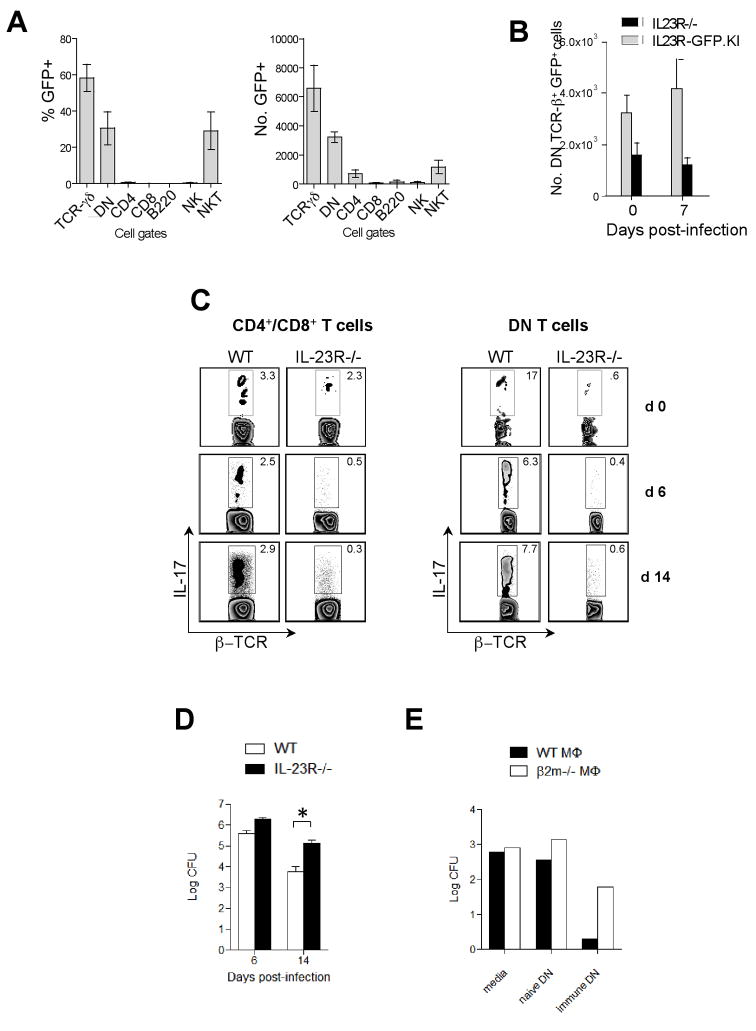
Figure 7. Role of IL-23R in F. tularensis LVS infection.
(A) Percentages and absolute numbers of IL-23R (GFP) expressing cells within δ-TCR+, DN, CD4+, CD8+, B220+, NK1.1+, PBS57/CD1d tetramer+ cell populations isolated from the lungs of uninfected IL-23R-GFP.KI mice. The bars represent mean ± SEM of 3 independent experiments (3–5 mice pooled/group/experiment). (B) Absolute numbers of IL-23R (GFP) expressing DN T cells isolated from the lungs of uninfected and F. tularensis LVS-infected IL-23R−/− and IL-23R-GFP.KI mice. The bars represent mean ± SEM of 3 independent experiments (3–5 mice pooled/group/experiment). (C) The dot plots represent IL-17 production by β–TCR+ CD4+/CD8+ and β–TCR+ DN T cells isolated from uninfected and F. tularensis LVS infected lungs of IL-23R−/− and WT mice. The experiment was repeated twice with 3–4 mice/group pooled in each experiment. (D) Bacterial CFU was determined in the F. tularensis LVS infected lungs of IL-23R−/− and WT mice [*p<0.05, **p<0.01 (two tail Student t-test)]. (E) F. tularensis LVS infected β2M−/− and WT macrophages were incubated with DN T cells isolated from the spleens of naïve or immune mice and bacterial burden was determined 72 h after culture. The experiment was repeated 3 times.

