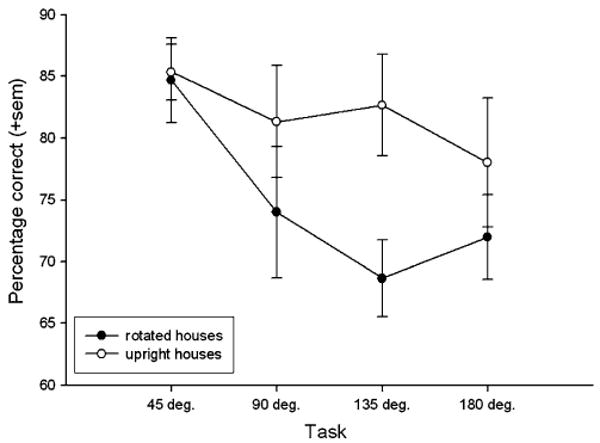
Fig. 3.

The mean percentage of correct responses (+sem) by subjects for discriminations of houses in the four orientation angles compared to upright control trials during that task session. The data for each angle of orientation represents a single 60 trial session, 30 rotated trials and the 30 upright control trials
