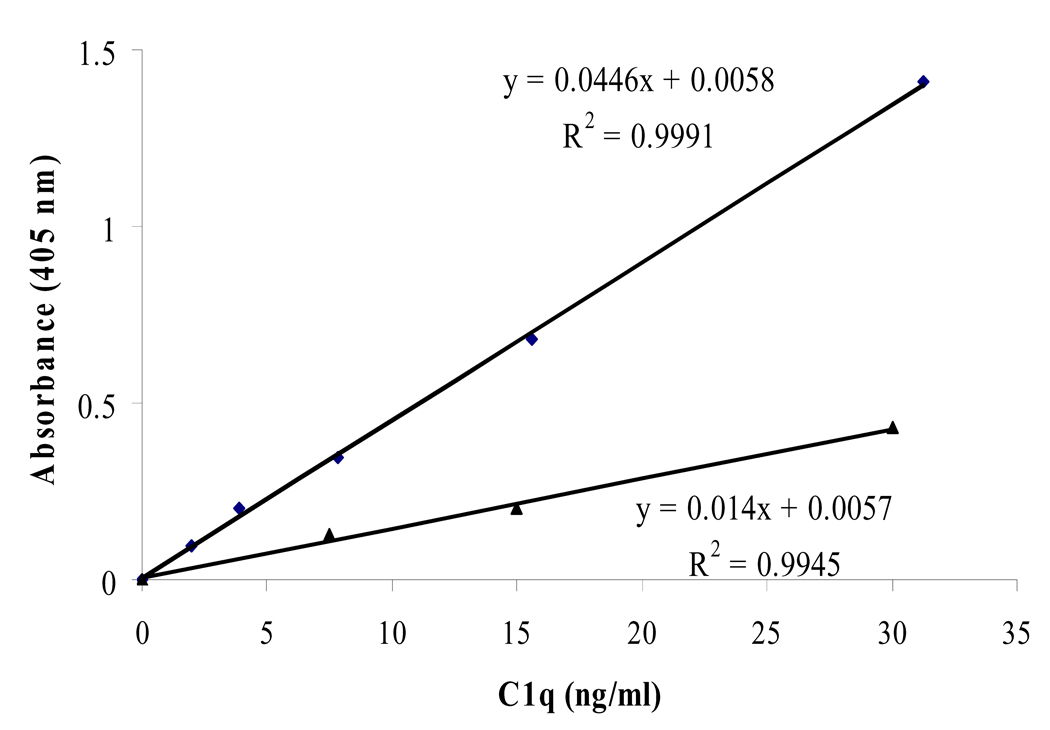
Figure 1.
The assay’s standard curve of C1q concentrations. A polystyrene plate was coated in the following order with: monoclonal anti-C1q (overnight), blocking solution (2hrs), sample C1q (overnight), polyclonal anti-C1q (2hrs), anti-IgG conjugated to an enzyme (1hr), and finally enzyme substrate (25mins). A quantifiable color signal, that is relative to C1q concentration, was produced and absorbance was read with a spectrophotometer.

