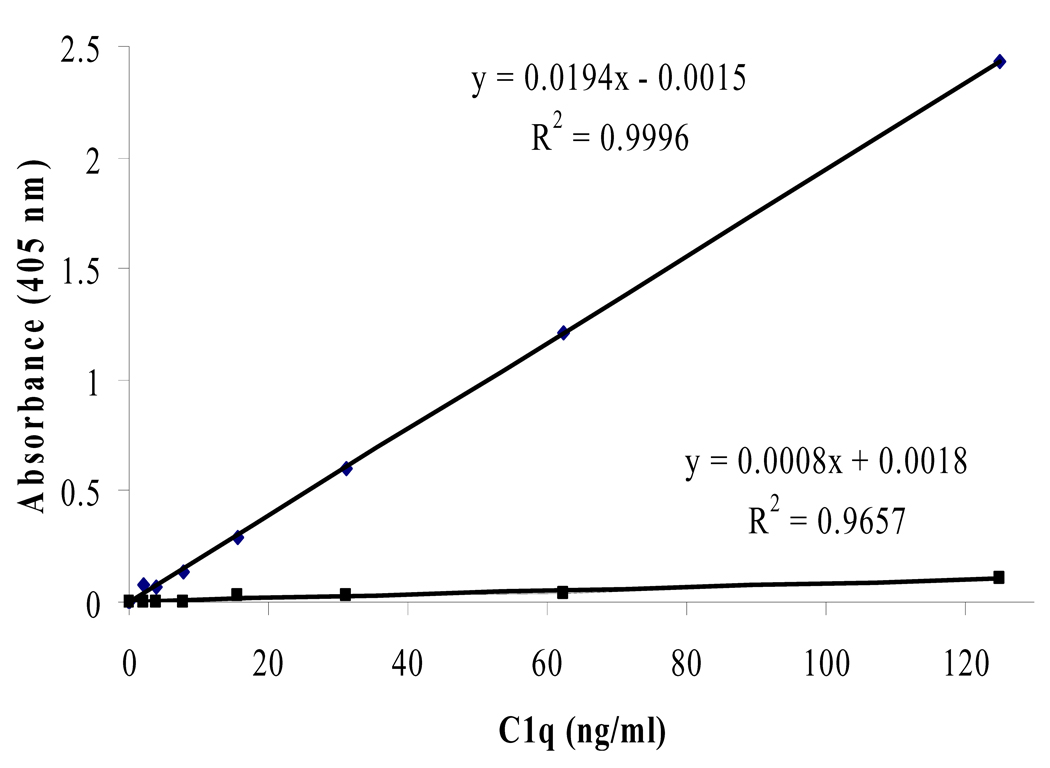
Figure 4.
The top trend line represents a standard curve obtained using a monoclonal capture Ab (i.e. our described method). The bottom trend line represents a standard curve obtained using a polyclonal capture Ab (i.e. published methods [3, 10]). Using polyclonal as the capture antibody is not preferred due to the ability of polyclonal to bind many epitopes of C1q and prevent follow-up binding of primary antibodies. Using our polyclonal anti-C1q as a capture Ab produced an unusable standard curve.

