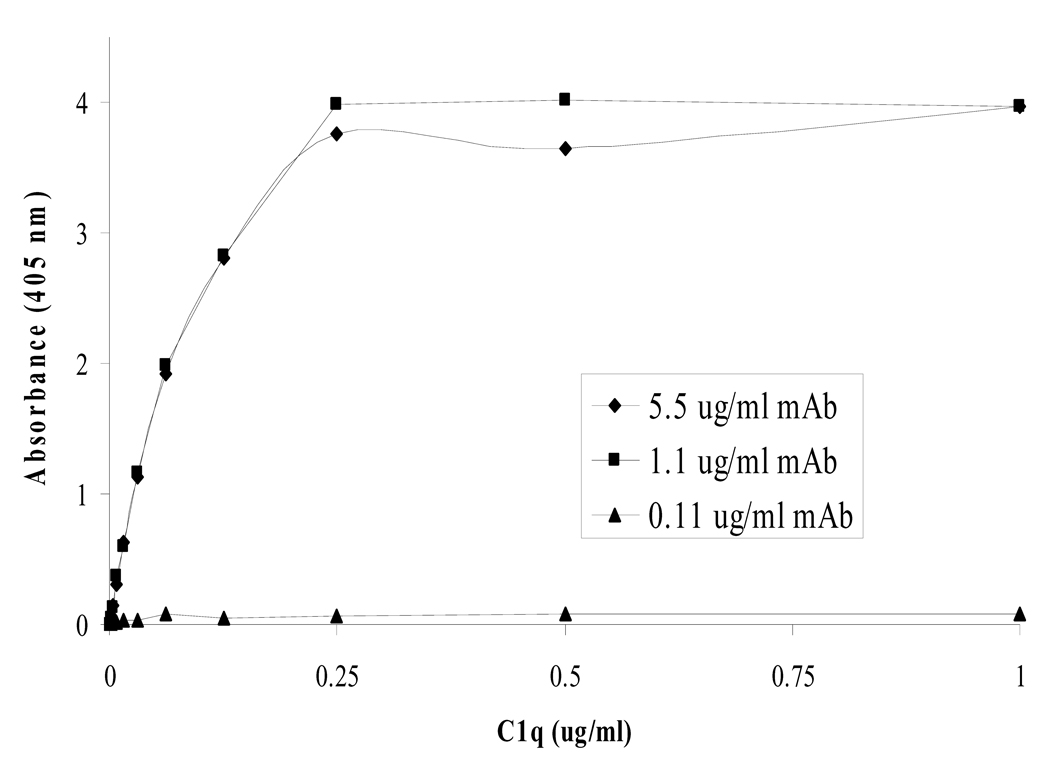
Figure 5.
Standard curves of C1q concentration were produced using different coating concentrations of monoclonal capture Ab in our described method. The 0.11 µg/ml dilution of monoclonal was too low and did not provide enough binding sites for all of the C1q, while the 1.1 and 5.5 µg/ml dilutions had reached coating saturation on the plate. This is in close agreement with the theoretical maximum coating concentration of 2.2 µg/ml calculated in figure 6.

