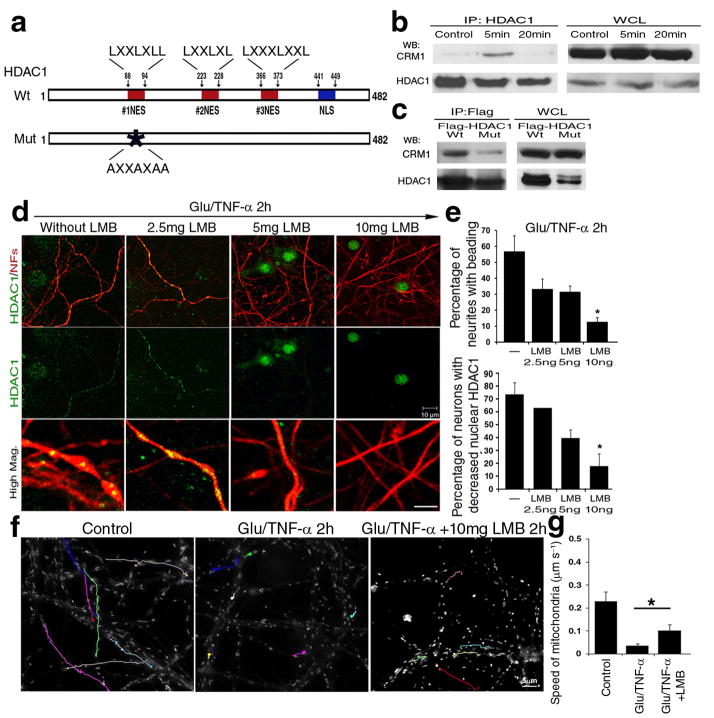
Figure 6. CRM1 dependent nuclear export of HDAC1 is essential for the induction of damage induced by glutamate and TNF-α.
(a) Schematic diagram of HDAC1 protein sequence, with potential nuclear export sequences (NESs, red), and nuclear localization domains (NLS, blue). (b) Protein extracts from cultured neurons either untreated or treated with toxic stimuli for 5 or 20 minutes were immunoprecipitated with antibodies specific for HDAC1 (IP:HDAC1) and processed for western blot analysis using CRM1 or HDAC1 antibodies. Whole cell lysates (WCL) were used as controls. (c) Wild type (Wt) and NES mutant HDAC1 (Mut) over-expression, followed by immunoprecipitation with anti-FLAG antibody and western blot analysis with anti-CRM1 and FLAG antibodies. (d) Immunocytochemistry of primary neurons pre-treated with increasing concentrations of leptomycin B (LMB) for 30min, then exposed to 50μM glutamate/200ng/ml TNF-α (Gluta/TNF-α) and stained with antibodies for HDAC1 (green) and NFs (red). Scale bar 10μm for low and 2 μm for high magnification. (e) Bar graphs indicate the percentage of beaded neurites relative to the total population (mean ± SD; *P < 0.05). (f) Pseudo-colored image of mitochondrial movement, using time-lapse video microscopy of primary neurons treated with LMB and exposed to glutamate and TNF-α. Untreated cultures were used as controls. Cultures were labeled with Mitotracker GreenFM and photograms were taken every 5 seconds within a 5 minute time period. Note that LMB treatment ameliorated mitochondrial movement. Scale bar 5μm. (g) Bar graphs indicate the average speed of moving mitochondria in each condition and error bars represent standard deviation *P < 0.05.

