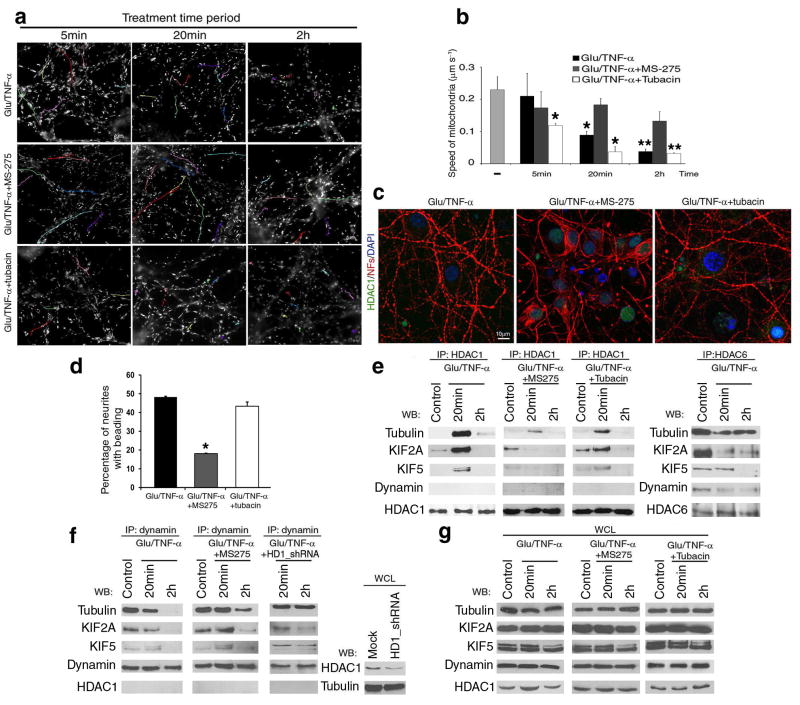
Figure 8. Activity-dependent interaction of HDAC1 with motor proteins impairs mitochondrial transport.
(a) Pseudo-colored image of time-lapse video-microscopy of neuronal cultures treated with 50μM glutamate/200ng/ml TNF-α in the presence of HDAC1 inhibitor MS-275, or HDAC6 inhibitor tubacin. Mitochondrial movement was examined using the lipophilic mitochondrial dye MitoTracker. Scale bar 5μm. (b) Bar graphs indicate the average speed of moving mitochondria (mean ± SD). *P < 0.05, **P < 0.01 (c) Confocal image of neurites in cultures treated with 50μM glutamate/200ng/ml TNF-α for 2 hours (Glu/TNF-α), or in the presence of MS-275 (Glu/TNF-α+MS-275) or tubacin (Glu/TNF-α+tubacin). Immunoreactivity for HDAC1 (green) and NFs (red); DAPI (blue) as nuclear counterstain. (d) Bar graphs represent the percentage of beaded neurites in (c) (Mean ± SD; *P < 0.05). (e) Protein complexes containing HDAC1 (left) or HDAC6 (right) and motor proteins were identified by immunoprecipitation and western blot analysis. Proteins were extracted from cultured neurons treated as indicated in (a). (f) Co-immunoprecipitation with anti-dynamin antibody of protein extracts from either untreated or MS-275 pre-treated neurons exposed to 50μM glutamate/200ng/ml TNF-α for 20min or 2 hours. Note that the association of dynamin from motors was partially restored by treatment with MS-275 or silencing HDAC1 with shRNAs. Silencing efficiency was confirmed by western blot analysis using HDAC1 antibody. (g) Western blot analysis of whole cell lysates (WCL) from cultures treated as described in (e) and (f).

