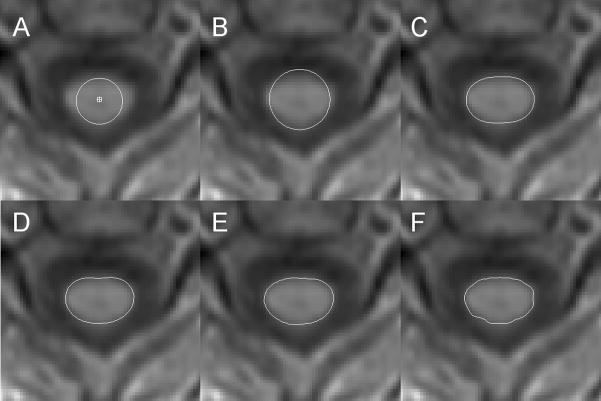
Figure 2.
For the AS method, evolution of the cord active surface at one z location (at the C2/C3 level) from a 3-D T1-weighted dataset. The image is displayed using bi-linear interpolation and thus appears less pixelated than the underlying image data. The cord segmentation algorithm uses a multi-resolution approach with steadily increasing refinement of the surface model by increasing the number of Fourier coefficients and order of polynomial fit to those coefficients that define the radius generator. Not all steps are shown here. A) shows the user-defined initial marker of the cord center-line and the initial surface of constant radius; B) shows the surface at equilibrium with 3 coefficients and a polynomial of order 2 (C3O2); C) shows C5O4; D) shows C7O6; E) shows C11O10; and F) shows C32O11.

