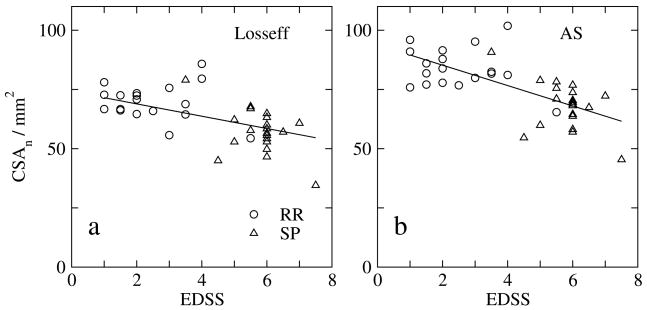
Figure 4.
Relationship between normalized mean cord cross-sectional area (CSAn) and EDSS score, for a) the Losseff method at C2 and b) the new AS method between C2 and C5. Relapsing-remitting (RR; n=18) and secondary-progressive (SP; n=20) MS patients are shown separately, but for the pooled data r = −0.51 (p < 0.001) for the Losseff method and r = −0.59 (p < 0.001) for the AS method after adjusting for age and sex.

