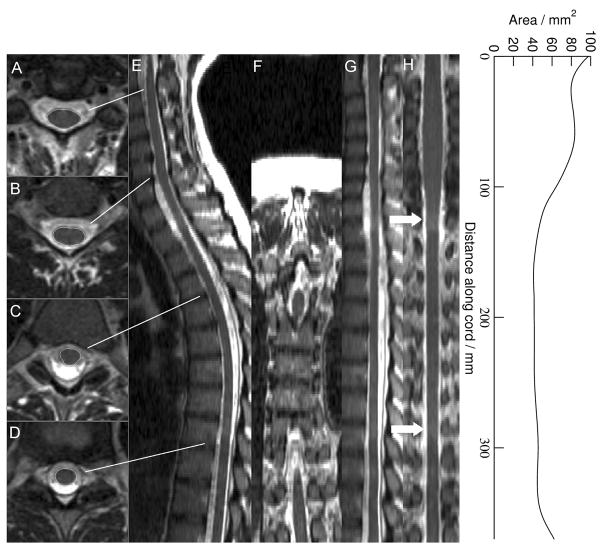
Figure 7.
Segmentation and unwrapping of the cord in an axial 2-D T2-weighted image. E and F show the original images reconstructed to sagittal and coronal views, while A (C2/C3 level), B (C6/C7), C (T4/T5) and D (T9/T10) show the cord segmentation at various representative levels down the cord as indicated. G and H show the unwrapped cord image in sagittal and coronal views over approximately the same section of cord, while the graph on the right indicates the cord cross-sectional area, measured in a plane perpendicular to the cord center-line. Note the high intensity artifacts seen at the T4/T5 and T9/T10 levels (arrows), which are caused by fact that the table moved between slice blocks. See Methods for more details of the scan acquisition parameters.

