
Figure 1.
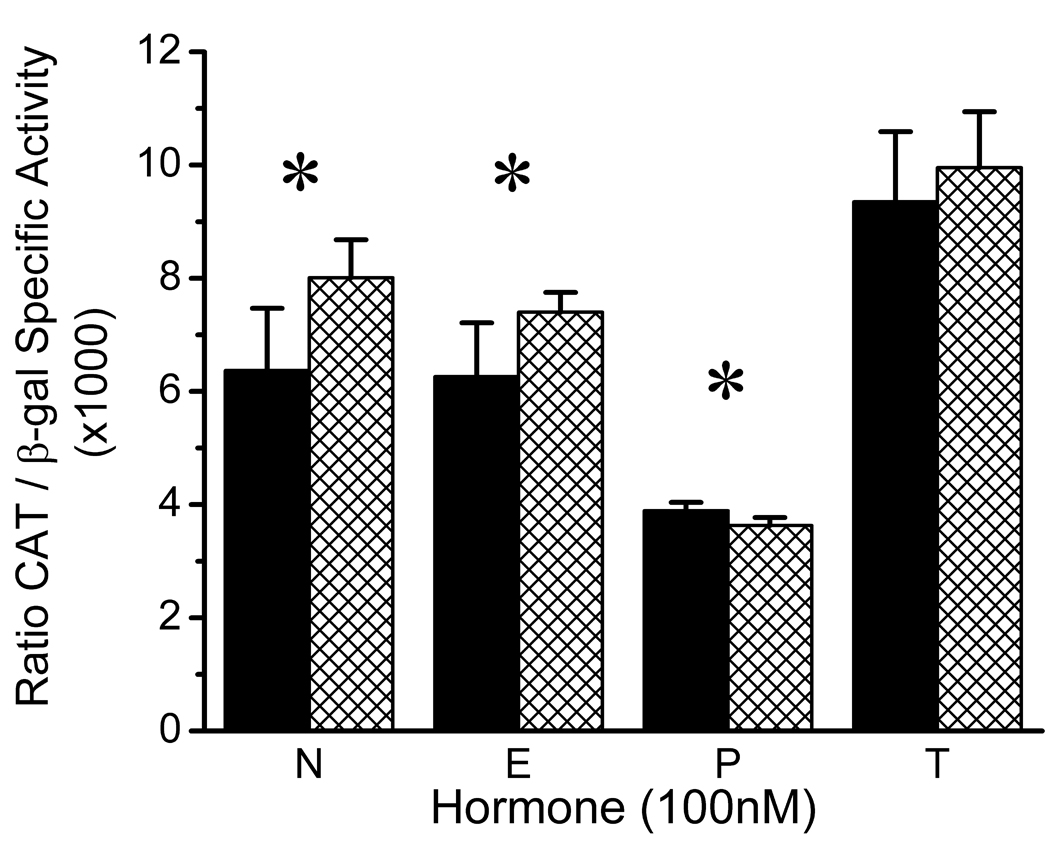
Effects of Gonadal Steroid Hormones on the Basal Activity of the Wild-Type and Variant CREB1 Promoters in CATH.a Neuronal Cells. Wild-type promoter, solid bars. Variant promoter, hatched bars. Corresponding means (±SD) for wild-type and variant promoter activity were: No Hormone (N), 6.37 (1.10) and 8.01 (0.67); 17 β-Estradiol (E), 6.26 (0.95) and 7.40 (0.35); Progesterone (P), 3.89 (0.15) and 3.63 (0.14); and Testosterone (T), 9.35 (1.24) and 9.95 (0.99). Results of two-way ANOVA: Hormone effect, F = 107.11; df = 3,40; p < 0.000001; Genotype effect, F = 11.21; df = 1,40; p < 0.002; Hormone×Genotype interaction, F = 3.04, df = 3,40; p = 0.04. All pairwise post hoc comparisons of hormone effects, p < 0.05, Tukey HSD, except for N vs. E (p = 0.69). Significant pairwise comparisons of G(−656)A genotypes within hormone conditions are indicated by an asterisk: N, t = 3.14, df = 10, p = 0.01; E, t = 2.76, df = 6.37, p = 0.03; P, t = 3.14, df = 10, p = 0.01.