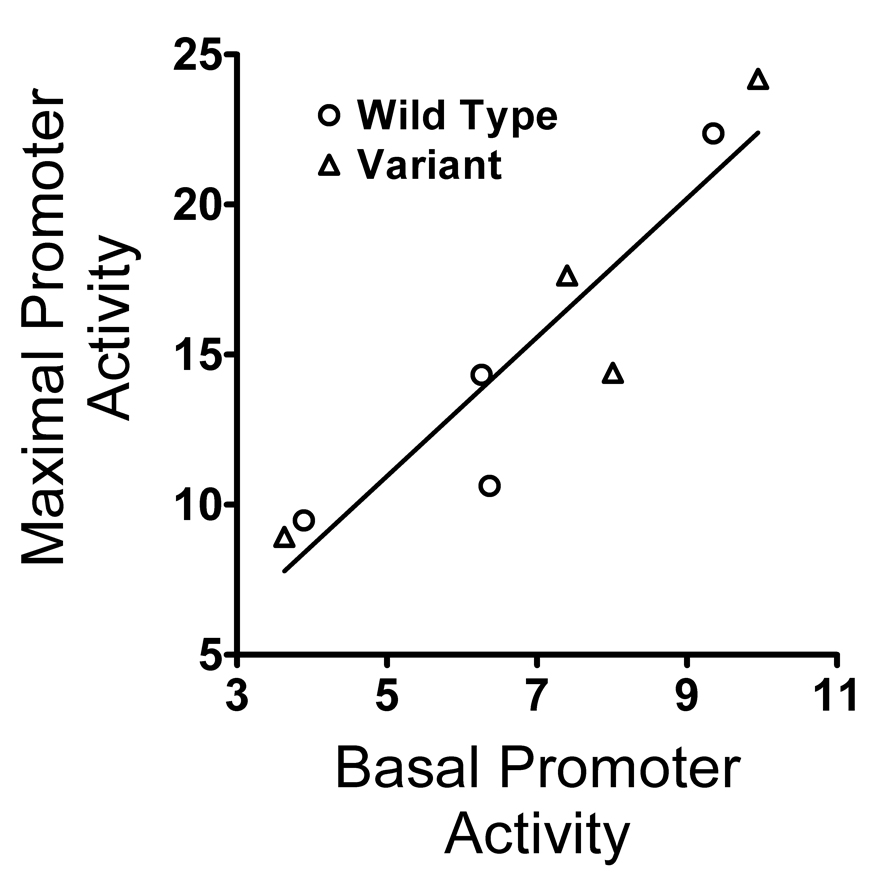
Figure 3.
Relationship of Basal and Maximal CREB1 Promoter Activitity Following Activation of the cAMP Signaling Pathway in CATH.a Neuronal Cells. Wild-type promoter, circle. Variant promoter, triangle. Linear regression: slope = 2.31; y-intercept = −0.61; x-intercept = −0.26; Pearson r = 0.925, p = 0.001; Spearman rho = 0.952, p = 0.0003.

