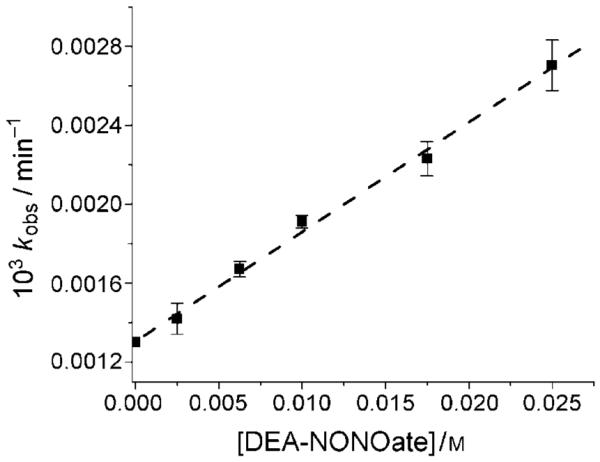
Figure 4.

Plot of observed rate constant kobs versus NONOate concentration for the reaction between HOCbl and DEA-NONOate at pH 10.80. The best fit of the data gives kapp =(0.056±0.002) Lmol−1 min−1 (slope) and kHOCbl =(1.32±0.03)×10−3 min−1 (intercept, 0.30m CAPS, I=1.0m (NaCF3SO3), 25.0°C).
