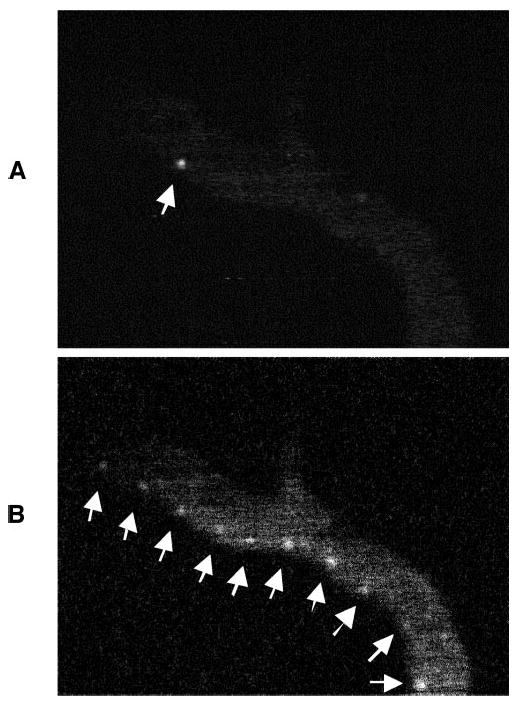
Figure 2.

Time course of the movement of the ICG hyperfluorescent cell (arrows) through the dermal vasculature. The movement of an ICG-hyperfluorescent cell (A) was evaluated by tracking through a sequence of video frames (B) taken with an in vivo confocal microscope.
