
Figure 4.
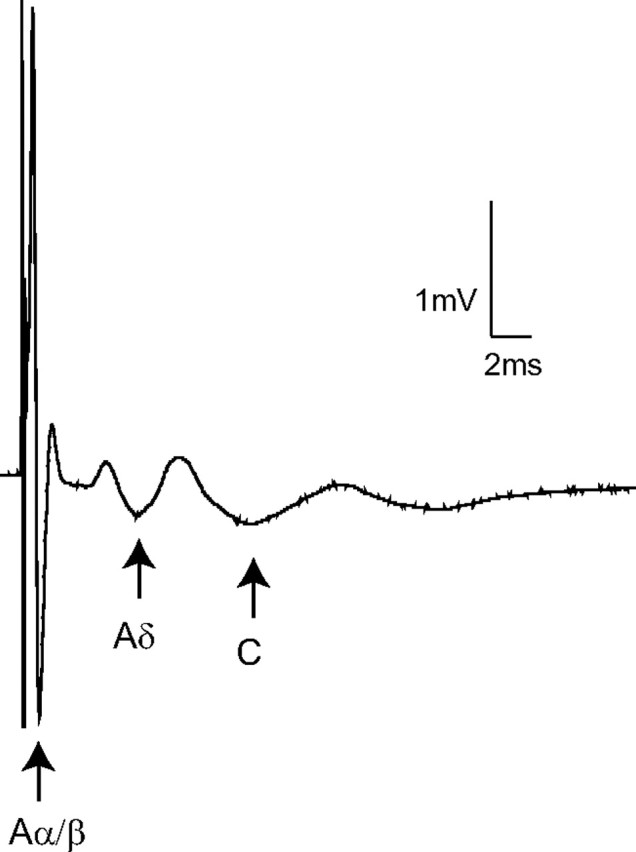
Extracellular compound action potential recordings. Representative compound action potentials recorded from an isolated rapamycin-treated dorsal root illustrating the fast (Aα/β-), medium (Aδ-) and slow (C-) conducting components evoked by 500 μA stimulation (average of 10 traces shown). Arrows indicate the negative peak of each triphasic (positive-negative-positive) profile. In this example the last positive peak of the Aδ-component overlaps the first positive peak of the C-component. The threshold stimulation intensities for the Aα/β-, Aδ-, and C-fiber components were 5, 60, and 200 μA, respectively.