Figure 3.
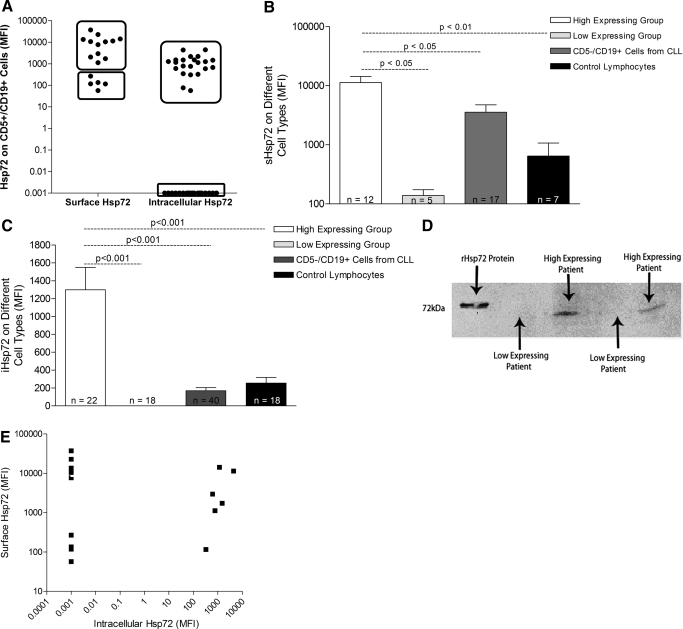
sHsp72 and iHsp72 expression on malignant and nonmalignant cells from CLL and control subjects. (A) sHsp72 and iHsp72 in CD5+/CD19+ cells from CLL patients were analyzed by flow cytometry. Values are expressed as absolute MFI and plotted on a log scale. (B) sHsp72 expression and (C) iHsp72 expression on the malignant (CD5+/CD19+) and normal B lymphocytes (CD5–/CD19+) from CLL patients and lymphocytes from control subjects. Each group of patients is represented as a mean + sem and plotted on a log scale. Statistical analysis was performed using the one-way ANOVA with Bonferroni’s multiple comparison test. sHsp72 analysis was performed on 17 CLL patients, and iHsp72 analysis was performed in 40 CLL patients. (D) Western blot of Hsp72 expression in high- and low-expressing CLL patients. Cell extracts were prepared from PBMCs purified from whole blood and are representative of 22 high-expressing patients and 18 low-expressing patients. (E) Correlation analysis between iHsp72 and sHsp72 in CD5+/CD19+ cells from CLL patients. Correlation analysis was performed using Spearman’s correlation coefficient, and P = 0.8864.

