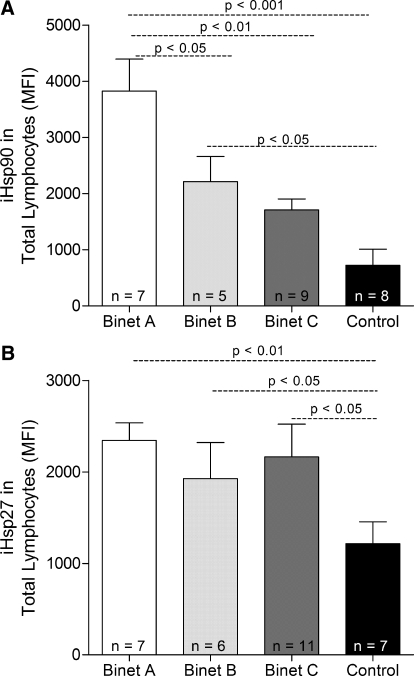
Figure 6.
(A) iHsp90 and (B) iHsp27 expression in total lymphocytes from CLL patients grouped according to Binet stage and in lymphocytes from control subjects.Each group of patients is represented as mean + sem. Statistical analysis was performed using one-way ANOVA with Bonferroni’s post-hoc test.

