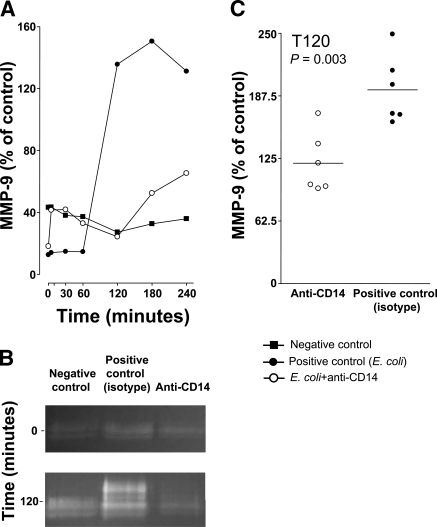
Figure 4.
MMP-9. MMP-9 was measured in selected samples from the E. coli arm of the study. A) Samples at all time points from one animal in each group were measured. B) Representative samples from 0 and 120 min showed a marked increase in MMP-9 in the isotype-matched positive control group after 120 min compared with baseline values. A modest increase in the anti-CD14 group and no increase in the negative control group were seen. C) Samples from 120 min were quantified, and the anti-CD14 group (n=6) was compared with the isotype-matched positive control (n=6) (mean, individual values, and P values are shown). The y axes of A and C are not comparable, because of different runs.

