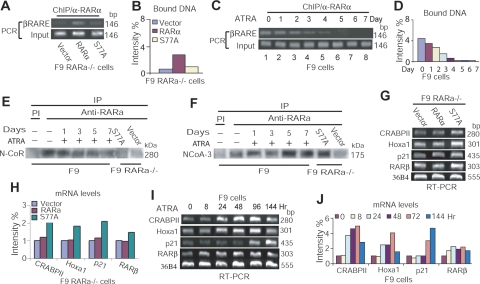
Figure 5.
Reduced RARα-RARE interaction and enhanced transactivation are accompanied by RARα dissociation from corepressor and association with coactivator. A) ChIP analysis of RARα-mβRARE interaction in transduced F9 RARα−/− cells. B) Densitometry quantification of RARα-bound DNA in panel A. Data represent 3 independent experiments with similar results, normalized against levels of input DNA. C) ChIP analysis of RARα-mβRARE interaction in F9 cells treated with ATRA. D) Densitometry quantification of RARα-bound DNA in panel C. Data represent 3 independent experiments with similar results, normalized against levels of input DNA. E) IP analysis of RARα/N-CoR interaction. F) IP analysis of RARαNCoA-3 interaction. G) RT-PCR analysis of gene expression in transduced F9 RARα−/− cells. H) Densitometry quantification of mRNA levels in panel G. Data represent 3 independent experiments with similar results, normalized against 36B4 levels. I) RT-PCR analysis of RA-target gene expression in F9 cells. J) Densitometry quantification of mRNA levels in panel I. Data represent 3 independent experiments with similar results, normalized against 36B4 expression.

