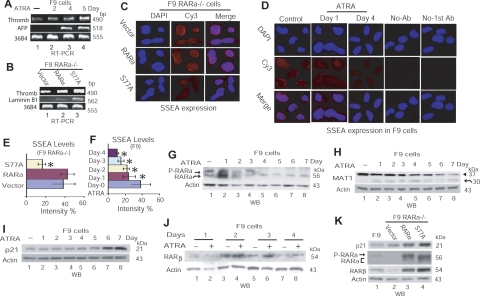
Figure 6.
Loss of RARαS77 phosphorylation leads to cancer cell differentiation. A, B) RT-PCR analysis of differentiation marker-gene expression in F9 cells (A) or transduced F9 RARα−/− cells (B). Thromb, thrombomodulin. C, D) Immunofluorescence detection of SSEA-1 expression in transduced F9 RARα−/− cells (C) or F9 cells treated with ATRA (D). E, F) Densitometry quantification of SSEA-1 levels in F9 RARα−/− cells in panel C (E; *P=0.000 vs. vector or RARα) and in F9 cells in panel D (F; *P=0.000 vs. control). Panel F presents expression levels of SSEA-1 at d 2 and 3; corresponding images are not shown in panel D. Values are means ± sd from 3 independent experiments. G–K) WB depiction of protein levels of various RA-target genes in F9 cells treated with RA (G–J) or in F9 RARα−/− cells transduced by RARα or S77A (K).

