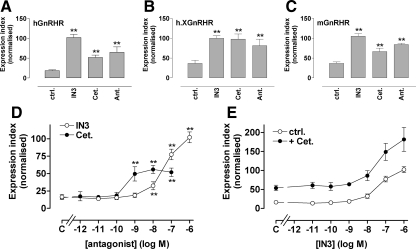
Figure 8.
Effects of peptide and nonpeptide antagonists on GnRHR expression in gonadotrope lineage cells. Panels A–C, LβT2 cells transduced with Ad HA-hGnRHR, HA-h.XGnRHR, or HA-mGnRHR were incubated 18 h with 10−7 m IN3, cetrorelix (Cet.), or antide (Ant.) before cell-surface hGnRHR quantification as above. Panels D and E, Cells were treated as above except that they were transduced with Ad HA-hGnRHR and the 18-h incubation was with the indicated concentrations of IN3 or cetrorelix (panel D) or with varied concentrations of IN3 with or without 10−7 m cetrorelix (panel E). Data shown are the cell-surface GnRHR EI and are means ± sems (n = 3–8) pooled from repeated experiments after normalization to the maximal internal control value with IN3. ANOVA with post hoc Dunnett's tests revealed that the effects of all three antagonists were significant at all three receptors (panels A–D; *, P < 0.05; **, P < 0.01). Two-way ANOVA of the data in panel E revealed IN3 and cetrorelix as significant variables (P < 0.01), but the IN3-cetrorelix interaction term was not significant (P > 0.05). ctrl., Control.

