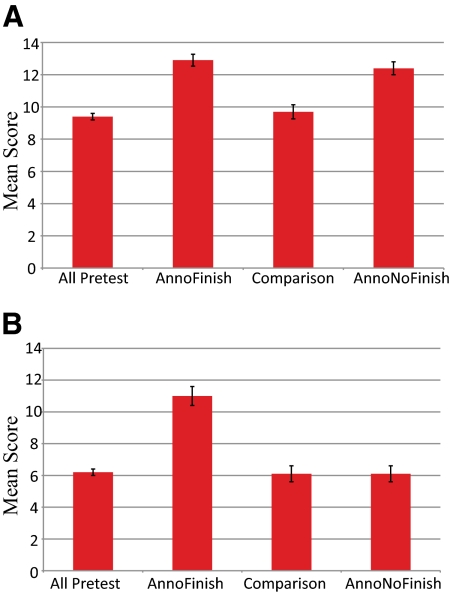
Figure 5.
Student quiz score results. The mean quiz score results show a significant increase in average test scores for GEP students who participated in the relevant project. The left column shows the average precourse score for all groups. The AnnoFinish group is made up of those students who participated in both an annotation-based project and a finishing-based project. The comparison group was the group of non-GEP students recruited at GEP-member schools (see text). The AnnoNoFinish group is made up of those students who participated in an annotation-based project but not a finishing-based project. (A) Annotation quiz (genes and genomes). (B) Finishing quiz (sequencing reactions and data analysis). Error bars represent 2 SEs above and below the mean.

