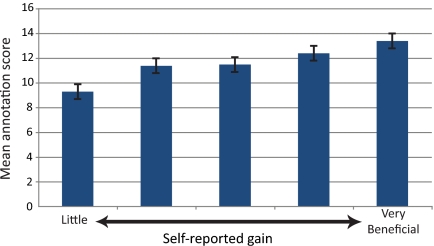
Figure 7.
Mean quiz score separated by self-reported gains. Groups of students were separated based on how much benefit they reported from “Annotating my gene/fosmid” on a 1 (little learning) to 5 (very beneficial) scale. The mean annotation quiz score is reported for each group. The overall analysis of these groups reveals significant differences (p < 0.05). The error bars represent 2 SEs above and below the mean.

