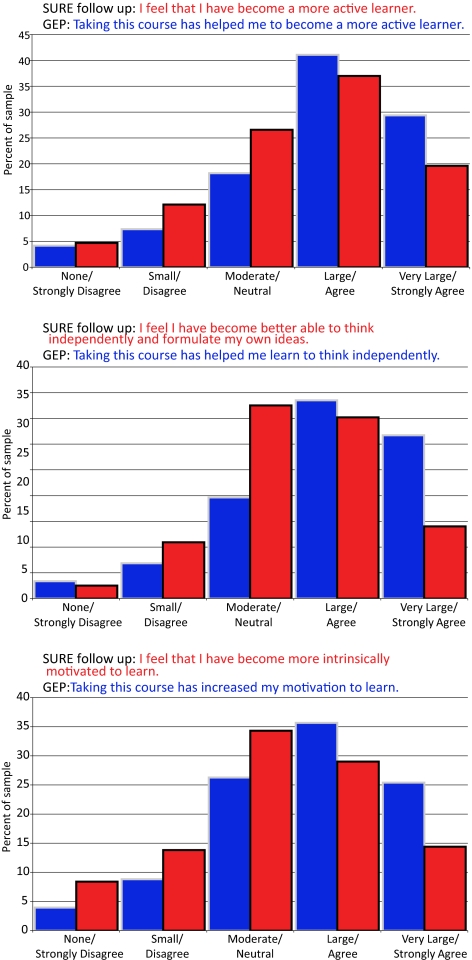
Figure 8.
Student-reported gains comparing a summer research experience (SURE) with a GEP academic year course (GEP). These graphs show the cumulative percentages of GEP and SURE respondents from both the 2007–2008 and 2008–2009 academic years. The students in each survey were responding to slightly different statements, shown in each chart. (Top) Thinking independently. (Middle) Motivation to learn. (Bottom) Active learner. The SURE statement is shown in red and the GEP statement is shown in blue.

