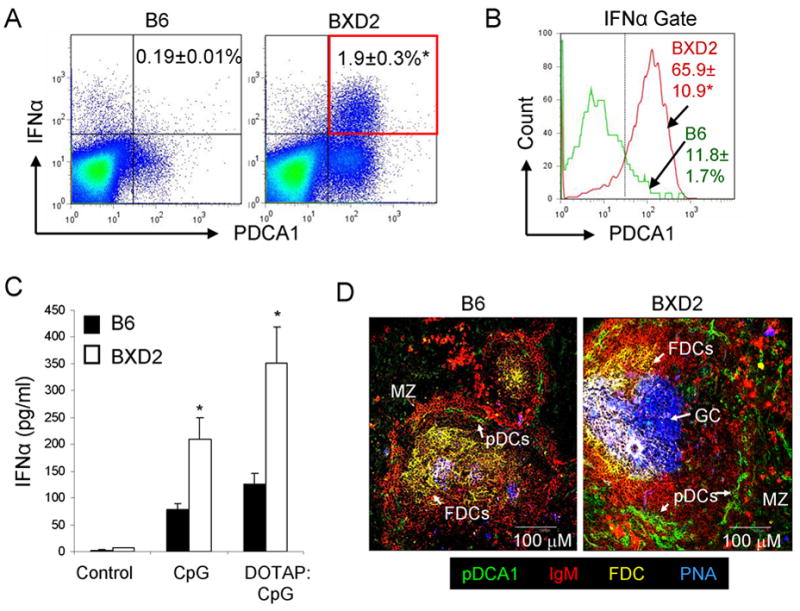
FIGURE 1.

Increased type I IFN-producing pDCs in the spleens of BXD2 mice. A, Flow cytometry was performed on B6 and BXD2 spleen cells labeled with anti-IFNα and anti-PDCA1 antibodies. Means ± SEM. (n=6); * P < 0.05 compared with B6 mice. B, Gating on IFNα+ cells, the frequencies of BXD2 and B6 PDCA1+ cells were determined. Means ± SEM. (n=6); * P < 0.05 compared with B6 mice. C, ELISA analysis of the levels of IFNα produced by unstimulated, CpG, or DOTAP complexed to CpG (DOTAP:CpG) stimulated pDCs isolated from the spleens of B6 (black bars) and BXD2 mice (white bars). pDCs were enriched and cultured in vitro for 24 hours with the indicated stimulations. Means ± SEM (n=6); * P < 0.05 compared with B6 mice. D, Confocal imaging analysis of spleen sections taken from B6 and BXD2 mice that were stained with fluorescent conjugated anti-PDCA1, anti-IgM, anti-CD35 (FDC), and PNA-biotin followed by an Alexa 350-conjugated secondary antibody as described in the Materials and Methods. Data are representative of three independent experiments.
