FIGURE 3.
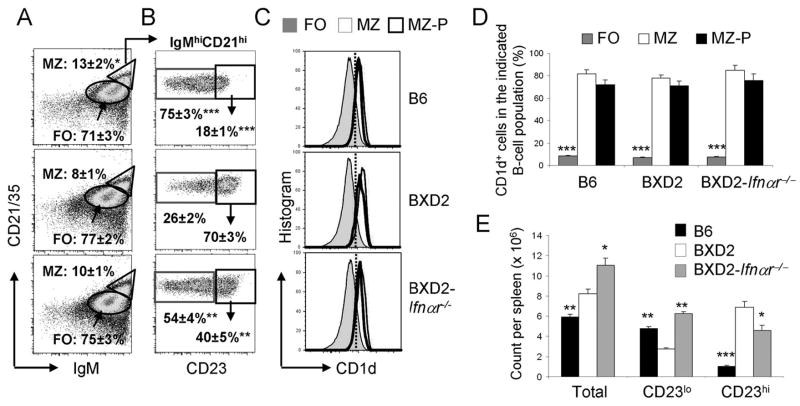
Increased MZ-P B cells in BXD2 mice. Single cell suspensions were prepared from the spleens of 3-mo-old B6, BXD2, and BXD2-Ifnαr−/− mice. A, Flow cytometry analysis of the percent of FO (oval) and total MZ (triangle) B (CD19+) cells in the indicated mouse strain. Means ± SEM (n=6); * P < 0.05 compared with wild-type BXD2 mice. B, Gated within the total IgMhiCD21hi B cells, cells were further gated as CD23null+lo MZ or CD23hi MZ-P B cells (rectangle gated cells). Means ± SEM (n=6); ** P < 0.01, or *** P < 0.005 compared with the same population of cells from wild-type BXD2 mice. C, Gating for CD23hiIgMhiCD21hi MZ-P, CD23null+loIgMhiCD21hi MZ, and FO B cell populations, cell populations were further gated for the percentage of cells expressing CD1d. D, Bar graph showing the average of CD1d expression in FO, MZ and MZ-P B cells. Means ± SEM (n=6); *** P < 0.005 compared with MZ or MZ-P B cells. E, Absolute counts of splenic IgMhiCD21hi (Total), MZ (CD23lo), and MZ-P (CD23hi) B cells. Means ± SEM (n=6); * P < 0.05, ** P < 0.01, *** P < 0.005 compared with the same population of cells from wild-type BXD2 mice.

