
FIGURE 6.
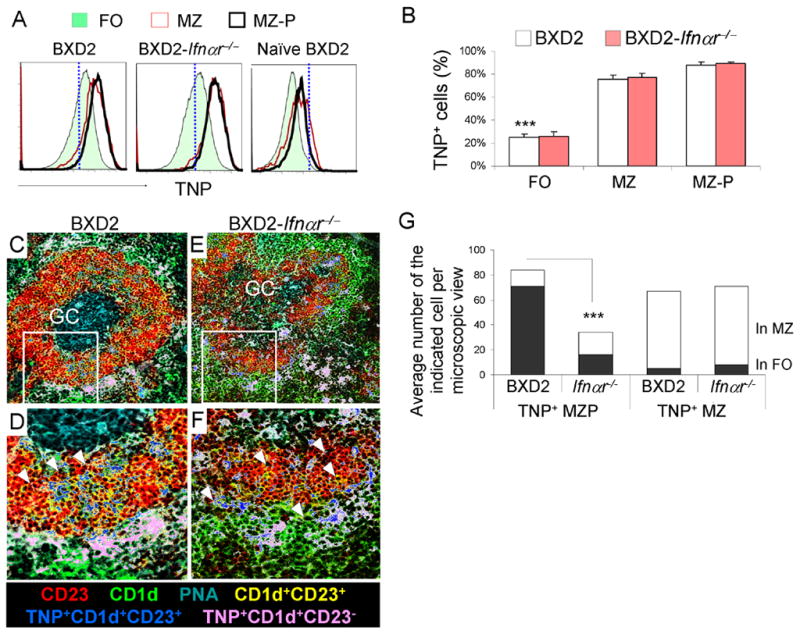
MZ-P B cells deliver Ag rapidly to the interior of FO and GC compared to MZ B cells in type I IFN-competent BXD2 mice. A, Flow cytometry analysis of splenic single-cell suspensions from BXD2 and BXD2-Ifnαr−/− mice 1hour after immunizing with TNP-Ficoll compared to naïve BXD2 mice. Gating on FO, MZ, MZ-P B cell subpopulations, TNP+ cells were determined. B, Bar graph showing the expression of TNP on each population of B cells. Means ± SEM (n=4); *** P <0.005 compared FO with MP or MZ-P B cells from either BXD2 or BXD2-Ifnαr−/− mice. C–F, Representative images taken using a confocal microscope showing the location of TNP+ MZ (CD21+CD23−)(pseudo-colored to pink) and TNP+ MZ-P (CD21+CD23+)(pseudo-colored to blue) in the spleens of TNP-Ficoll injected BXD2 (C) and BXD2-Ifnαr−/− mice (E). Selected areas were further enlarged to illustrate the inner migration of TNP+ MZ-P B cells towards a spontaneous GC in the spleen of the representative BXD2 mouse (D) and lack of such behavior in the spleen of the representative BXD2-Ifnαr−/− mouse (F) (original objective lens magnification ×10 for C and E; ×40 for D and F). G, Quantitative counts of TNP+ CD23hiCD1dhi (light blue) and TNP+ CD23loCD1dhi (pink) B cells in the anatomic location of MZ and FO; A chi-square test comparing percentages of the blue cells in the FO between BXD2 and BXD2-Ifnαr−/− mice (*** P < 0.005; results are the average number, n=12 randomly chosen follicles of the indicated cell per microscopic view from spleen sections from each strain).