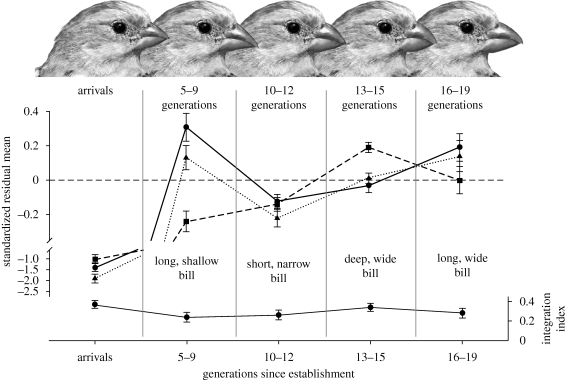
Figure 1.
Distinct, but similarly integrated beak morphologies during 19 generations following establishment of house finches in northwestern Montana, USA. Upper drawings illustrate reconfiguration of beak morphology by tpsSuper (v. 1.03) from a consensus position based on displacement of 10 homologous landmarks (black circles in the arrivals group) within each group of generations and is shown for illustration only. Middle graph shows microevolutionary change in standardized (mean = 0, s.d. = 1) beak length (circles, solid line), depth (squares, dashed line) and width (triangles, dotted line) across generations. Lower graph shows integration index (mean ± 1 s.e.) calculated for three beak components as I = [∑(λi−1)2/6]1/2 (Cheverud et al. 1983), where λi is an eigenvalue of the correlation matrix of the normalized data (table 1). Statistical significance of the integration coefficient was obtained by resampling, with replacement, of the within-principal component loadings (n = 500).

