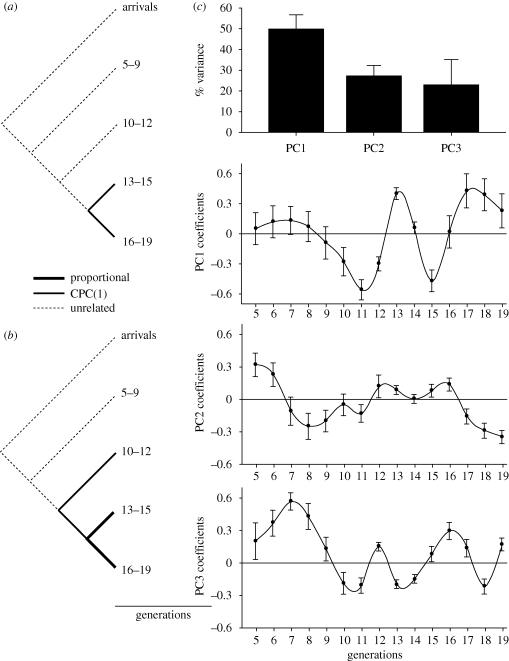
Figure 2.
Microevolutionary trends in covariance structure of beak morphology illustrate widespread interchangeability and compensatory variation in beak components during microevolutionary change. The CPC analysis of shared covariance structure in (a) males and (b) females during 19 generations after population establishment. Line thickness indicates the hierarchy of shared covariance structure. (c) Eigenanalysis of changes in covariance structure across generations (conventional PC analysis of the covariance matrices of CPC1 scores of each generation). Shown is percentage of variance accounted by the first three eigenvalues across all generations and coefficients of corresponding eigenvectors. Error bars are bootstrapped s.e. (n = 100). High covariation among generations would produce consistently increasing or decreasing PC loadings across generations, while fluctuating PC loadings among generations indicate negative covariation among some generations and might be produced by compensatory growth of different beak components in different generations (table 5).

