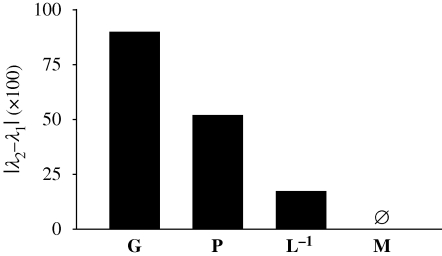
Figure 3.
Relative difference between the first (λ1) and the second (λ2) eigenvalues of additive genetic covariance matrix (G, table 4), phenotypic covariance matrix (P, table 1), matrix of ontogenetic variation (L−1, table 5) and matrix describing adaptive landscape (M, table 3) in Montana house finches over 19 generations after population establishment. Smaller values indicate greater dimensionality of variability. The third eigenvalues were not significant in any of the matrices.

