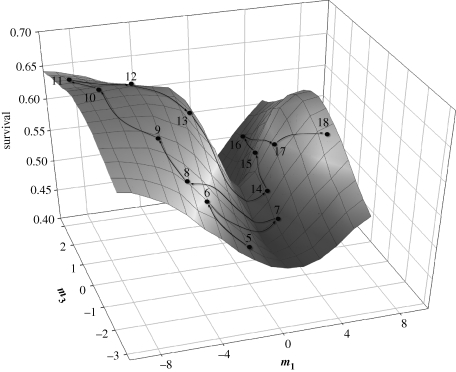
Figure 4.
Overall fitness surface (juvenile postfledging survival) defined by the canonical axes m1 (variation in beak depth) and m3 (relative expression of beak length and beak width) (table 3). Dots show average coordinates of m1, m3 and survival for each generation (shown by numbers), starting with generation 5. Arrows connect subsequent generations. G matrix orientation (85% along m1 and 8.7% along m3) largely coincides with the orientation of M matrix.

