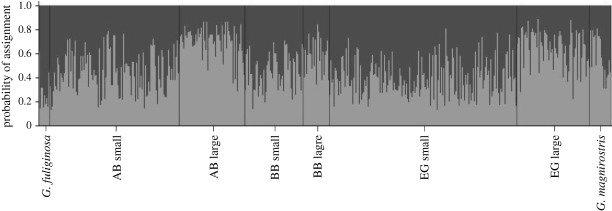
Figure 6.
Bayesian clustering analysis of population structure performed in Structure v. 2.1. Black bars represent the separation between different groups: G. fuliginosa, G. fortis (AB small, AB large, BB small, BB large, EG small and EG large) and G. magnirostris, AB, Academy Bay; BB, Borerro Bay; EG, El Garrapatero.

