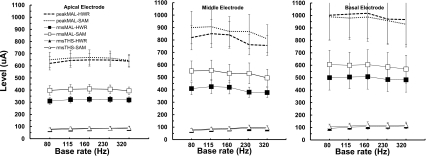
Figure 2.
THS and MAL as a function of base modulation rate averaged across subjects. Each panel represents the data for a different electrode location across the array. Open and filled symbols represent SAM and HWR stimuli, respectively. Triangles show THS values, squares show MAL values, and circles replot MAL values in terms of peak (rather than rms) amplitude. Error bars represent 1 s.e. of the mean.

