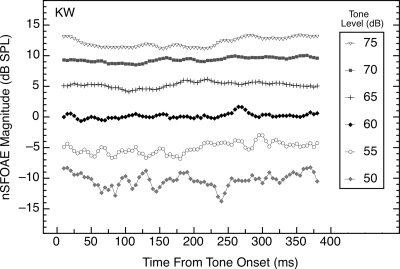
Figure 1.
Magnitudes and time courses of the nSFOAE responses to tones (4.0 kHz, 400 ms) of differing sound-pressure levels. Data are from subject KW, but they are representative of data from other subjects. The overall nSFOAE response was obtained by averaging the difference waveforms from 50 triplets; then the first 20‐ms segment of that averaged waveform was bandpass filtered at 4.0 kHz (filter width of 400 Hz) and the rms level calculated. The filter window was advanced in 1‐ms steps, and at each step, the rms level was calculated again. For this, and for all other figures, only every fifth value from the moving window is plotted. The first data point of each function was deleted because it reflected the 5‐ms rise time of the stimulus. Additional data points at the end of each function also were deleted once there were too few values remaining to fill the 20‐ms analysis window. Note that here, and in all subsequent figures, the abscissa value of each data point marks the beginning of a 20‐ms (or 10‐ms) window of analysis. Thus, the data point at 20 ms represents the strength of the nSFOAE response from 20 to 40 ms. For this and all subsequent figures, the noise floor of the measurement system was about −15 dB SPL.

