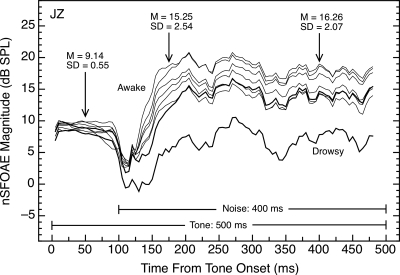
Figure 11.
Magnitudes and time courses of nSFOAE responses to tone-plus-noise for one subject in four different test sessions. The magnitude of the nSFOAE response was quite similar for the initial 100 ms of tone-alone but showed greater variability during the dynamic segment of the response initiated by the onset of the noise. The response obtained while the subject was drowsy was not included in the summary statistics shown; the typically shaped, heavy trace above was obtained after steps were taken to reverse his drowsiness. The average time constant for the six gray traces at the top of the figure was 22.3 ms. Similar patterns of response were seen in other subjects.

