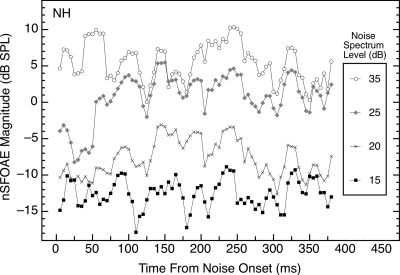
Figure 2.
Magnitudes and time courses of the nSFOAE responses to the same sample of wideband noise (0.1–6.0 kHz, 400 ms) presented at differing spectrum levels. Data are from subject NH, but they are representative of data from other subjects. The average nSFOAE waveform to wideband noise-alone was processed in the same way as for tone-alone (see caption for Fig. 1).

