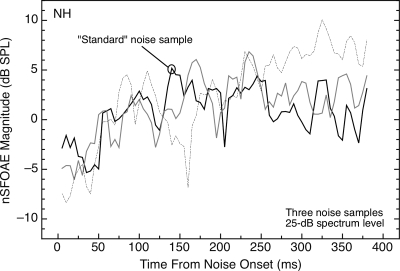
Figure 3.
Magnitudes and time courses of the nSFOAE responses to three different samples of synthesized noise (each 0.1–6.0 kHz, 25 dB in spectrum level, and 400 ms in duration). The basic forms of the results are highly similar, but the patterns of fluctuation differed across the samples of noise. The “standard” sample was the one used for Fig. 2 and elsewhere. Results are shown for subject NH; one additional subject was tested and showed similar results.

