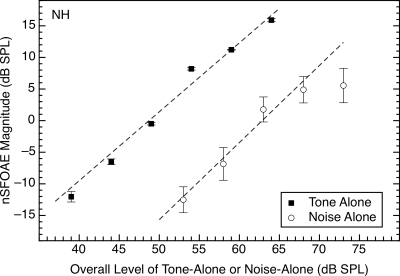
Figure 4.
Effect of stimulus level on the nSFOAE response when the 4.0‐kHz tone or the wideband noise was presented alone. The abscissa values for noise-alone denote overall level. The estimates of nSFOAE were obtained from the output of a 400‐Hz-wide filter centered at 4.0 kHz. The values plotted are the nSFOAE responses averaged over a 200‐ms time period beginning 150 ms after the onset of the 400‐ms tone or noise. Error bars show one standard deviation. The moment-to-moment variability in the tone-alone responses (see Fig. 1) was so small that the error bars are barely discriminable from the symbols themselves except at the lowest tone level, while the moment-to-moment variability in the response to the noise clearly was affected by the variability in amplitude in the wideband noise sample at all levels (see Fig. 2). For this subject, the slopes of the best-fitting straight lines were 1.09 and 1.22 for the tone-alone and noise-alone data, respectively.

