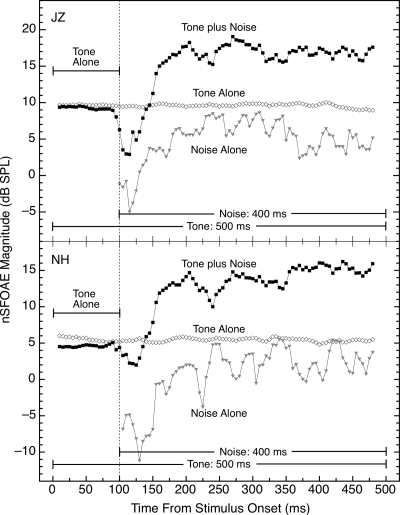
Figure 5.
Magnitude and time course of the nSFOAE response to tone-plus-noise compared to the response for tone-alone and noise-alone. For both subjects, all data shown were collected in the same test session. The magnitude of the immediate decline in nSFOAE response following noise onset was different for the two subjects. The level of the 4.0‐kHz tone was 60 dB and the spectrum level of the wideband noise was 25 dB; the tone was 500 ms in duration and the noise was 400 ms in duration. Note the hesitation of about 25 ms prior to the beginning of the dynamic rise in the nSFOAE response for tone-plus-noise during which the nSFOAE magnitude decreased. The analysis procedure was the same as for Fig. 1. Note that the specific values on the ordinates are different for the two panels but the scales are the same.

