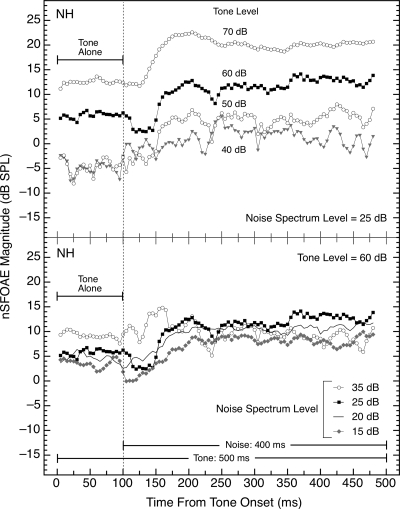
Figure 8.
Magnitudes and time courses of the nSFOAE responses when either the level of the tone was varied and the level of the simultaneous wideband noise was held constant (top panel) or the reverse (bottom panel). The tone was 4.0 kHz and 500 ms in duration; in the top panel, its level was varied as indicated and in the bottom panel, its level was 60 dB SPL. The noise was 0.1–6.0 kHz in width and 400 ms in duration; in the top panel, its spectrum level was 25 dB and in the bottom panel, its level was varied as indicated. The level of the tone had more effect on the magnitude of the nSFOAE response than did the level of the noise. The solid black symbols in the two panels are the same data. Similar data were obtained from additional subjects.

