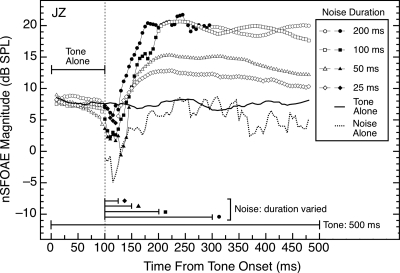
Figure 9.
Magnitudes and time courses of the nSFOAE responses to a 4.0‐kHz, 60‐dB tone of 500‐ms duration when the duration of the wideband noise (0.1–6.0 kHz, 25 dB spectrum level) was varied from 25 to 200 ms. Noise onset was 100 ms after onset of the tone. Solid symbols indicate the presence of the noise for each condition. Note the hesitation of about 25 ms between noise onset and the beginning of the rise of the dynamic response. The noise-alone data from Fig. 5 are shown at the bottom of the figure for comparison. Except for the noise-alone data, all conditions were measured in the same test session. Similar data were obtained from other subjects.

