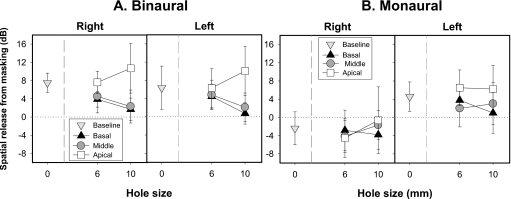
Figure 3.
Average SRM (±SD) in decibels are plotted as a function of spectral hole size for the baseline and the three different hole placement conditions (basal, middle, and apical). Panel A represents binaural data and panel B represents monaural data. The horizontal dotted line represents 0 dB SRM.

