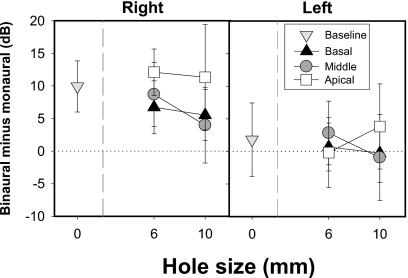
Figure 5.
Average SRM values (±SD) are plotted as the difference in decibels between monaural and binaural SRTs. A positive value indicates greater SRM due to listening binaurally; consequently, a value near zero indicates minimal differences between monaural and binaural SRTs. Data are plotted as a function of spectral hole size with 0 mm refers to the baseline conditions. These data are plotted for the basal, middle, and apical hole conditions.

