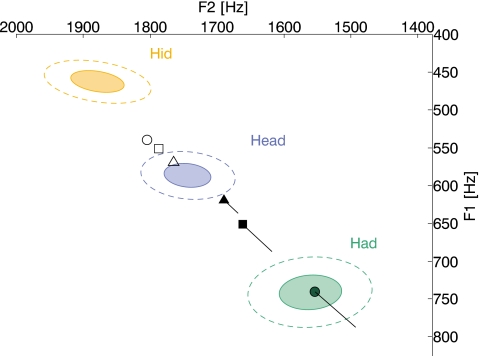
Figure 3.
Experiment 1 results superimposed on an average talker’s production of ∕ɪ∕, ∕ε∕, and ∕æ∕. Each pair of concentric ellipses indicates the distribution of an average talker’s production of ∕ɪ∕, ∕ε∕, and ∕æ∕ in an ∕hVd∕ context. The center of each pair of ellipses indicates the mean production of an average individual and the solid and dashed ellipses indicate 1 and 2 standard deviations, respectively. The average-steady state results for Shifts 1, 2, and 3 are indicated by the triangle, square, and circle symbols, respectively. Open symbols indicate the average production, while the filled symbols indicate the average acoustic feedback. The three lines indicate the effect of compensation on the acoustic feedback. The ends of the lines opposite the filled symbols indicate the acoustic feedback talkers would have heard if they did not compensate.

