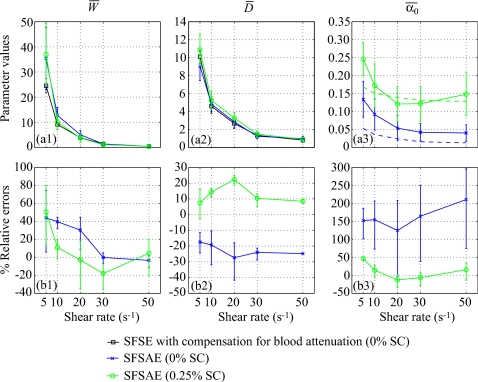
Figure 7.
(a) Values of , , and (in dB/MHz) for different residual shear rates estimated by the SFSAE for the 0% and 0.25% SC concentrations. Also represented are values of and estimated by the classical SFSE with compensation for blood attenuation for the 0% SC concentration and values of in dashed lines. (b) Corresponding relative errors of , , and .

