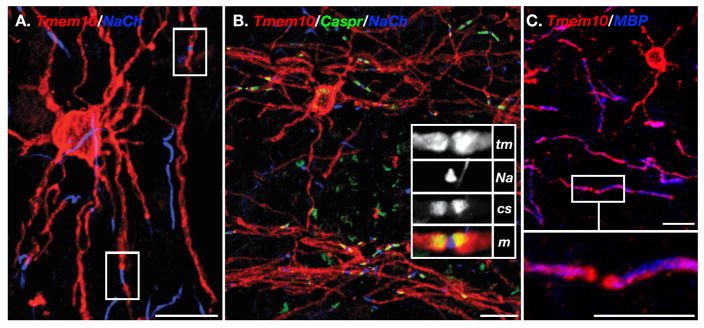
Figure 4. Enrichment of Tmem10 at the paranodes.
A. Double immunolabeling of mouse frontal cortex with an antibody to Tmem10 (red), and Na+ channels (blue). The location of two nodes is boxed. B. Mouse frontal cortex tissue was immunolabeled with antibodies to Tmem10 (red), Caspr (green) and Na+ channels (blue). Higher magnification of a nodal area is shown in the inset (tm, Tmem10; Na, Na+ channels; cs, Caspr; m, merged). C. Immunolabeling of Caspr−/− mouse cortex with antibodies to Tmem10 (red) and MBP (blue). Higher magnification of the boxed area is shown in the lower panel. Scale bars: A–B, 20 μm; C, 10 μm.

