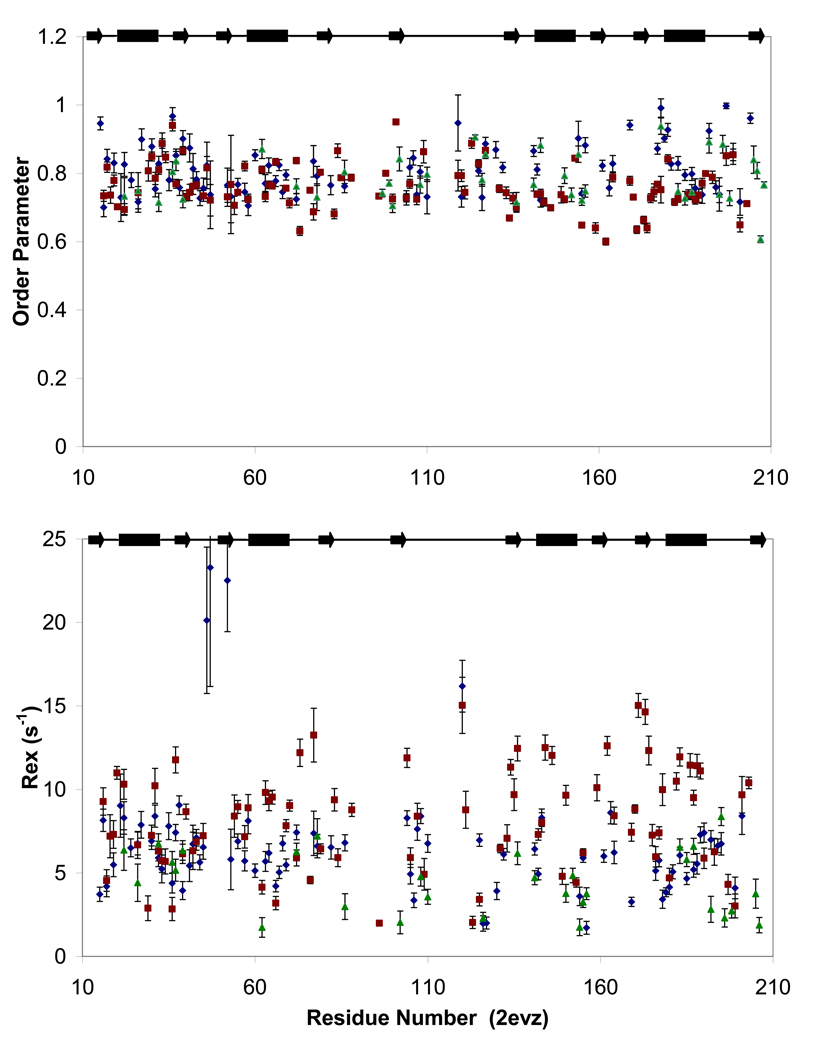
Figure 5. Fast and slow dynamics of PTB1:34.
Order parameters (S2, top panel) reflecting ps-ns motions and Rex terms (bottom panel) indicating slow (µs-ms) motions are similar for PTB1:34 at 300 µM (green triangles) and 1 mM (blue diamonds) at 700 MHz, and in a global fit of 1 mM PTB1:34 relaxation data at 500 and 600 MHz (red squares). Modelfree fits to T1, T2, and 1H/15N NOE data do show some variation for order parameters and Rex terms for the three parameter sets, but the trends are consistent. The two data sets at 700 MHz differ primarily in the properties of the residues flanking the loops, but most notably in the global tumbling times with τM= 7.2 ± 0.06 ns at 300 µM and τM = 9.2 ± 0.10 at 1mM. While protein self-association is likely to contribute to chemical exchange, we propose that it is not responsible for the extensive Rex terms that pervade PTB1:34 in all conditions here. Data are plotted against residue number (PDB ID: 2EVZ) with secondary structure elements indicated at the top.

