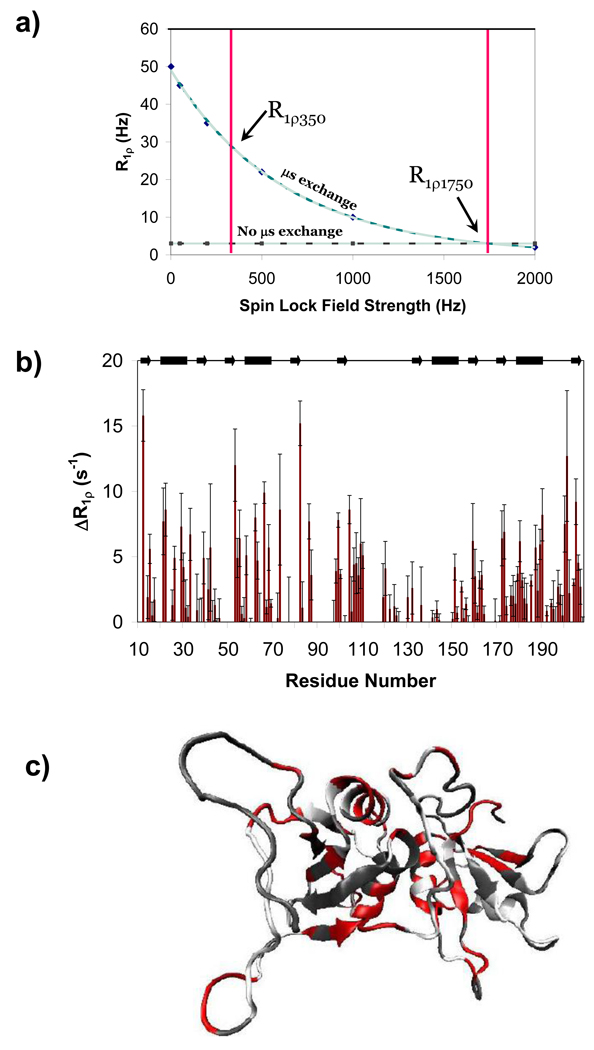
Figure 8. Residues which undergo microsecond exchange are identified by ΔR1ρ experiments, and are in qualitative agreement with the ModelFree results.
A schematic representation of ΔR1ρ is shown in (a) with dispersion curves for a residue with microsecond exchange (blue curve) and a residue with no microsecond exchange (grey curve). Importantly, this figure shows the propensity of the method to underestimate the exchange contribution to R2 because the R1ρ rates at the spin lock field strength of 0 Hz cannot be extrapolated for non-two-state systems. ΔR1ρ results are shown in (b), plotted against residue number, and mapped onto the 3-dimensional structure in (c) (PDB ID: 2EVZ). These results indicate that residues throughout PTB1:34 are in microsecond exchange, and substantiate the Rex terms obtained from ModelFree.

