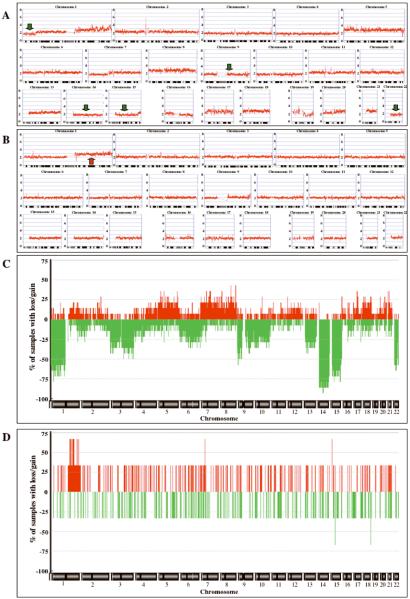
Figure 2.
Genome-wide plots of SNP CN copy data (A, B) and frequency plots of CN alterations (C, D) for samples analyzed with the Affymetrix GeneChip® Human Mapping 50K Xba Array. (A) KIT-mutant GIST #8. (B) KIT/PDGFRA-mutation-negative GIST #15. Copy-number values (0–8) are indicated to the left of each panel, chromosome labels and ideograms are shown at the top and bottom of each panel, respectively. Green and red arrows indicate selected regions of CN loss and gain, respectively, that are discussed in the text. (C) Frequency plots of CN alterations in 14 mutant GISTs. (D) Frequency plots of CN alterations in 3 mutation-negative GISTs. Chromosome labels are shown at the bottom of each panel, frequency values to the left of the panel. Determination of CN gains (red) and losses (green) was done using the ACE algorithm (Analysis of Copy Error, CGH-Explorer, University of Oslo, Norway), which was used with a False Discovery Rate (FDR) of 0.0001.

