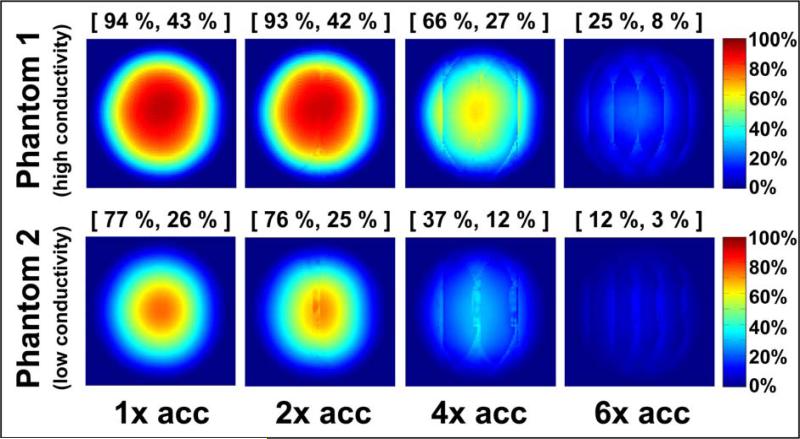
Figure 3.
Coil performance maps at 2.89 T for a central axial slice through each of two homogeneous spherical phantoms with equal dimensions and different electrical properties (“high conductivity”: σ = 0.97 Ohm−1m−1, εrel = 81.3; “low conductivity”: σ = 0.084 Ohm−1m−1, εrel = 80). The performance of the 32-element head array with respect to the ultimate SNR is shown for each phantom at various acceleration factors. Each pixel represents the experimental SNR divided by its corresponding ultimate SNR value. Above each map, the maximum and the mean performance are indicated in brackets and reported as a percentage of the optimum. The mean is computed including only the pixels inside the circular cross-section of the object.

